Air Quality in Hitchin
History
1994 – 2012. The national rise in the popularity of diesel engines.
Until recently, Hitchin had two areas where air quality was poor, both caused by emissions from diesel vehicles. Diesel engines produce less carbon dioxide (CO2) per mile than petrol engines and therefore have less impact on global warming. To drive down CO2 emissions, in 2001, road tax for diesel vehicles was reduced, sometimes to zero. Unsurprisingly, between 1994 and 2012, the proportion of all cars on UK roads powered by diesel rose from 7.4% to 32.7%1.
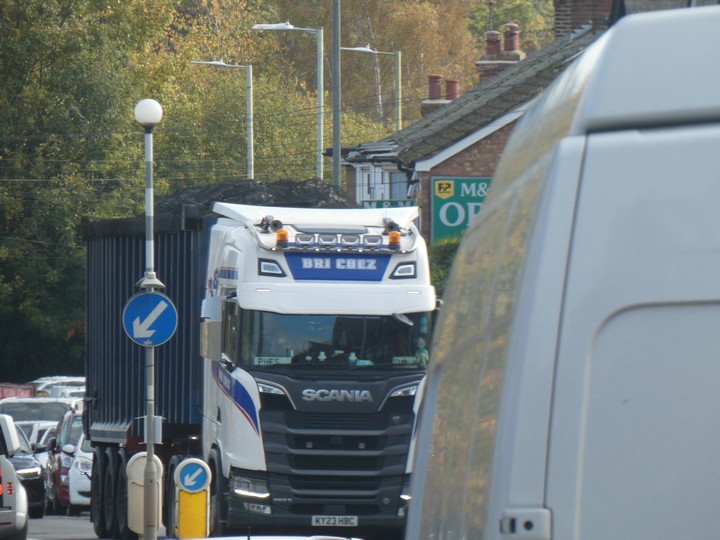
By comparison with petrol engines with catalytic converters (i.e. vehicles built since 1993) diesel engines produce significantly more nitrogen dioxide (NO2) and particulates, especially when vehicles move slowly or their engines are idling as a result of congestion. Goods vehicles were, and still are, predominantly powered by diesel engines.
2012 – 2024. Hitchin’s Air Quality Management Areas.
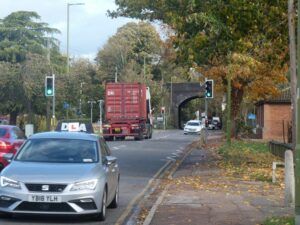
During the years leading up to 2012, levels of nitrogen dioxide (NO2) exceeded national limits at several points in Stevenage Road on the approach to the Three Moorhens roundabout. The exceedances were attributed to a high proportion of goods vehicles using the road, coupled with congestion at peak times. North Hertfordshire District Council (NHDC, more recently NHC – North Hertfordshire Council) estimated, using vehicle count data, that in 2013, cars (which made up 83% of vehicles using Stevenage Road) only contributed 46% of NO2 emissions.
NHDC was required to declare an Air Quality Management Area (AQMA) for Stevenage Road in 2013. The resulting Air Quality Action Plan (AQAP)2 identified 22 measures, of which the majority were quite general in nature, for example promoting walking and cycling for home to work or school journeys, or measures to increase the uptake of electric vehicles. Several measures which might more directly impact the situation, for example ‘Review parking provision and restrictions along Stevenage Road with the aim of reducing congestion’ foundered due to the failure to secure funding. A further measure to ‘Investigate an alternative route of access for heavy goods vehicles (HGVs) from the east/ southeast to the Cadwell/ Wilbury/ Burymead industrial area of Hitchin’ was funded and carried out, but no changes have resulted so far.
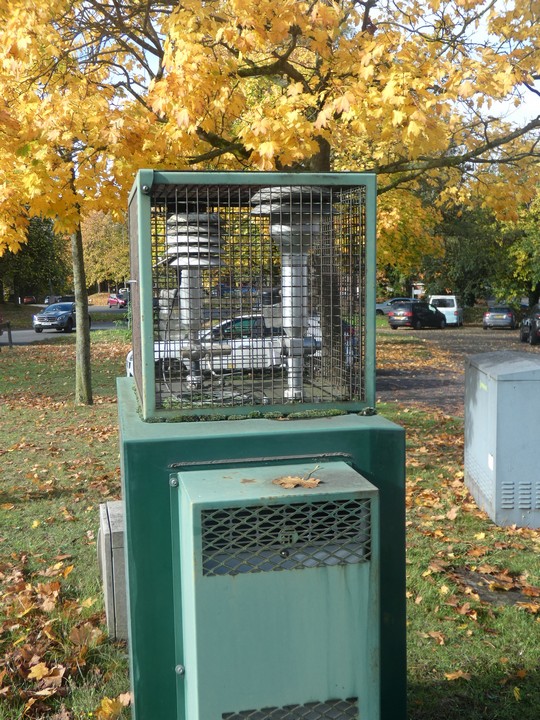
A second AQMA near the library roundabout, with a separate AQAP to address the same problem was declared in 2016. Since then, measured NO2 levels have fallen below the target level (called the Air Quality Objective – AQO) in both areas for 5 consecutive years. As a result, North Hertfordshire Council will revoke both AQMAs on 19th November 2025.
If the AQAP measures were unlikely to reduce it, why has the level of NO2 decreased?
As older vehicles are gradually replaced, levels of emissions decrease. This is not simply because the performance of an engine declines with age. The European Union has introduced increasingly stringent emissions requirements over the last 30 years. Although Britain has left the EU, the requirement to meet EU emissions standards remains. The current emissions standards (Euro 6) were introduced between September 2014 and September 2016, depending on the type of vehicle, and are about to be superseded by Euro 73. Forced to comply with Euro 6 standards, manufacturers produced vehicles with better emissions characteristics during the period covered by the AQMAs. Meanwhile, the proportion of older vehicles in the national fleet that did not conform to Euro 6 has decreased.
How dangerous are NO2 emissions and are there other types of emissions that cause concern?
NO2 occurs alongside very fine particulates, PM2.5. Both NO2 and PM2.5, can be breathed-in and can have serious health impacts. It isn’t easy to separate the effects of NO2 and particulates, or to say what their combined health impact might be, but it is significant. A paper from Kings College London in 2015 for Transport for London and the Greater London Authority4 estimated that, for the year 2010, the total number of deaths in London attributable to the combined effects of NO2 and PM2.5 was between 3,537 and 9,416, emphasising the uncertainty of such estimates. Even the lower bound of 3537 avoidable deaths is, of course, unacceptable.
Figures for North Hertfordshire equivalent to the London estimates for the combined effects of NO2 and PM2.5 don’t seem to be available. However, PM2.5 levels were estimated to account for 5.6% of all deaths for those over 25 in the district in 20105. NHC has comparatively recently begun to monitor PM2.5 using a monitor installed in Stevenage Road in July 2015. The health impacts of fine particulates have increasingly been studied and are thought to be so serious that there is no safe minimum level for them. Larger particulates – PM10 are thought to be less harmful – unlike PM2.5, they are less able to penetrate deep into the lungs or enter the bloodstream. Monitors for PM10 have been in use in Stevenage Road since 2015 and at Hitchin Library since 2011, although the latter site is now closed. Levels of PM10 have never exceeded current ‘acceptable’ limits at the monitoring locations in Hitchin. That does not mean that there is no danger, and with no safe minimum level for PM2.5 the World Health Organisation is advocating much more stringent limits. There is push-back on this from manufacturers and in 2023, government delayed applying a statutory limit of 10 µg/m³ (1µg = 1 millionth of a gram, 1m3 = 1cubic meter) for PM2.5 until 20406.
How concerned should we be?
It is important to stress that high roadside measurements of a pollutant do not necessarily translate into dangerous levels of exposure for all road users or local residents, and that all measurements are subject to significant (but quantifiable) errors.
Recently, a study in London7 has investigated the impacts on different groups of road users, – pedestrians, cyclists, bus passengers and vehicle drivers. In the past it was assumed that cyclists and pedestrians were more vulnerable, but it has become apparent that drivers are exposed to higher levels of emissions than first thought in congested situations such as often occur in London. The health benefits of active travel for cyclists and walkers tend to balance out the impacts of pollution on those groups to some extent. On the other hand, drivers who use the same congested routes frequently are at significantly higher risk.
Generally the levels of congestion on Stevenage Road do not compare with those at large London junctions. A relatively short stretch of road is involved, and those crossing the road will experience exposure for a short time. There are relatively few residents whose homes front the road for whom exposure will be more long term, and it should be pointed out that exposure falls off rapidly away from the road.
Will there be improvements in future?
Although Euro 7 emissions standards for tailpipe emissions are largely similar to Euro 63, a major change will be that emissions testing will need to be done under more realistic conditions rather than in a laboratory on a rolling road, which is expected to make the standards harder to meet. In addition, Euro 7 will be the first set of emissions standards which attempt to drive down emissions due to brake and tyre wear. To ensure vehicles remain cleaner for longer, under Euro 7, cars and vans will be expected to maintain emissions below specified limits for 10 years or 200,000 kilometres (124,000 miles). It will be interesting to see how these new requirements will be addressed – brake and tyre wear depend not just on the vehicle, but on the characteristics of the brake pads and tyres. How will it be possible to test a new vehicle in such a way that its performance long into the future can be guaranteed?
If we assume that the measurements can be done and the limits enforced, it is likely that there will be a shift in emphasis away from tailpipe emissions to those from brakes and tyres. By 2030 transport (tailpipe) emissions of nitrogen oxides in London are predicted to have fallen by 78% compared with 2019. At the same time, fine particulate (PM2.5) emissions from transport are only expected to fall by around 33%4.
The predicted decrease in tailpipe emissions reflects the expected uptake of electric vehicles. However, there is a downside to that. Electric vehicles tend to be heavier than their petrol and diesel counterparts. They have the capacity to accelerate more rapidly and their reduced running costs may result in greater distances travelled. That results in accelerated brake and tyre wear, the emissions from which tend to be particulate in nature. These emission rises are only partially countered by reductions resulting from regenerative braking.
From a regulatory standpoint, there should be a reduction in emissions nationally, and the Stevenage Road area would be expected to benefit. However, assuming it will not be overturned at judicial review, the recent decision by the Secretary of State for Transport to consent to the expansion of Luton airport will result in increases in traffic using the A602/Hitchin bypass/A505 corridor. Widening is proposed at both the Three Moorhens and library roundabouts to ease flow. It could be argued that this might reduce congestion and therefore improve air quality. This was not the opinion of the Planning Inspectors;
‘….. The Examining Authority accepts the Applicant’s conclusion that such effects are not deemed to be significant, however the ExA considers that such effects would contribute to a non significant worsening of air quality in proximity to the Affected Road Network ……’
In the light of the long delay before a statutory minimum level for PM2.5 is implemented, what exactly is meant by ‘non-significant’ is unclear. The most recent figure available for PM2.5 in Stevenage Road was in 2022 (data for 2023 – the most recent that might be available – was lost, itself a cause for concern) was about 8µg/m3(9), which is well below the current (non-statutory) limit of 25µg/m3. An increase of 25% to 10µg/m3, might well be described as ‘non-significant’ compared to the current ‘limit’, but it would take the level of particulates to the suggested WHO target, which gives cause for concern. Let us hope the Inspectors are right in their judgement and that PM2.5 emissions will remain below 10µg/m3.
An opportunity?
A significant proportion of the lorries passing through the about-to-be rescinded AQMAs are bound for the metal processing sites on Hitchin’s industrial estate. Those lorries are often in queues at the Grove Road / Cadwell Lane traffic lights and in Cadwell Lane itself creating the very conditions for harmful emissions. Residents talk about the fumes and dust that they are daily subjected to. The dust is not only from the vehicles themselves, but from their loads which are open to the atmosphere. When vehicles offload at the industrial estate sites, dust is also created. It would be good if the ‘redundant’ PM2.5 monitor from Stevenage Road could be used to find out exactly what the potential damage could be and to build the case to re-site those operations to somewhere more suitable.
References
1.Vehicle Licensing Statistics: 2012 Department for Transport.
2.Action Plan for the Stevenage Road Hitchin Air Quality Management Area. North Hertfordshire District Council 2013
3.Euro 7 emissions standard: what is it and when does it come into effect? RAC February 2025
https://www.rac.co.uk/drive/advice/emissions/what-is-euro-7-and-when-does-it-start/
- Understanding the Health Impacts of Air Pollution in London. Kings College London
5.Estimating Local Mortality Burdens Associated with Particulate Air Pollution
6.The Environmental Targets (Fine Particulate Matter) (England) Regulations 2023
https://www.legislation.gov.uk/uksi/2023/96/regulation/4/made
7.In-Vehicle Exposure to Traffic and Road Generated Air Pollution. Environmental Research Group, Imperial College London 2023
https://www.london.gov.uk/sites/default/files/2023-09/In-vehicle%20exposure%20to%20traffic%20and%20road-generated%20air%20pollution.pdf
8.London Luton Airport Expansion Examining Authority’s Report of Findings and Conclusions and Recommendation to the Secretary of State for Transport (2025)
9.2024 Air Quality Annual Status Report (ASR) North Herts Council
https://www.airqualityengland.co.uk/assets/documents/North_Herts/ASR_NHC_2024.pdf